Multiple Choice
Identify the
choice that best completes the statement or answers the question.
|
|
|
Order the integers from least to greatest.
|
|
|
1.
|
–2, 1, –9, 8, –8
a. | –8, –9, –2, 8, 1 | c. | –9, –8, –2, 1,
8 | b. | 1, 8, –9, –2, –8 | d. | –9, 8, 1, –2,
–8 |
|
|
|
2.
|
–20, 17, 16, –2, 8
a. | –2, –20, 16, 8, 17 | c. | –20, –2, 8, 16,
17 | b. | 8, 16, 17, –2, –20 | d. | 16, 8, –20, –2,
17 |
|
|
|
3.
|
3, 11, –19, 8, –18
a. | –18, 3, –19, 8, 11 | c. | –19, –18, 3, 8,
11 | b. | –19, 8, 11, –18, 3 | d. | –19, 11, 3, 8,
–18 |
|
|
|
Graph the number and its opposite.
|
|
|
4.
|
–5
|
|
|
5.
|
|
|
|
6.
|
–7
|
|
|
Find the absolute value.
|
|
|
7.
|
| –27 |
a. | –| –27 | | c. | –| 27 | | b. | –27 | d. | 27 |
|
|
|
8.
|
| –113 |
a. | –| –113 | | c. | 113 | b. | –| 113 | | d. | –113 |
|
|
|
9.
|
| 169 |
a. | 169 | c. | –169 | b. | –| –169 | | d. | –| 169 | |
|
|
|
10.
|
| 9 |
|
|
|
Copy and complete the statement using <, >, or =.
|
|
|
11.
|
–7  12
|
|
|
12.
|
–16  | 1 |
|
|
|
13.
|
17.25  | 13.25 |
|
|
|
14.
|
17.5  –4.75
|
|
|
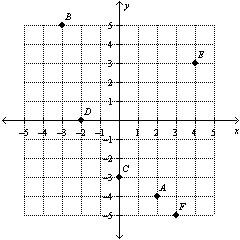
Write an ordered pair corresponding to the point.

|
|
|
15.
|
Point E
a. | (3, 4) | c. | (4, 3) | b. | (–3, –4) | d. | (–4,
–3) |
|
|
|
16.
|
Point D
a. | (2, 0) | c. | (–2, 0) | b. | (0, –2) | d. | (0, 2) |
|
|
|
Reflect the point in the x-axis followed by the
y-axis.
|
|
|
17.
|
|
|
|
18.
|
|
|
|
19.
|
|
Other
|
|
|
1.
|
Extended Response The table shows the cumulative total number of
points a basketball player scored through the first 12 games of the season. | Game | 1 | 2 | 3 | 4 | 5 | 6 | 7 | 8 | 9 | 10 | 11 | 12 | | Total Points | 7 | 25 | 34 | 54 | 66 | 83 | 98 | 106 | 126 | 139 | 155 | 171 | | | | | | | | | | | | | |
a. Create a
table for the number of points scored during each game. b. Display the data from part
(a) in a line graph. c. What was the greatest number of points the player scored in a
single game? d. What was the least number of points the player scored in a single
game? e. In the 13th game, the player had the best
shooting night of his season. He scored 17 points more than 40% of his previous single game greatest
score. How many points did he score?
|