Multiple Choice
Identify the
choice that best completes the statement or answers the question.
|
|
|
1.
|
The scatter plot below shows the amount of weight towed by a vehicle and its
average miles per gallon. 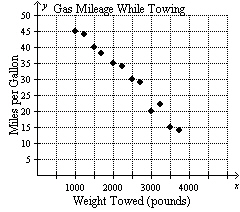 How many pounds does the vehicle that gets 15
miles per gallon tow? How many miles per gallon does the vehicle that tows 2000 pounds
get? What tends to happen as the weight towed by a vehicle increases? a. | 3500 pounds; 35 mi/gal; As the weight towed by the vehicle increases, the
miles per gallon increases. | b. | 3000 pounds; 40 mi/gal; As the weight
towed by the vehicle increases, the miles per gallon decreases. | c. | 3000 pounds;
40 mi/gal; As the weight towed by the vehicle increases, the miles per gallon
increases. | d. | 3500 pounds; 35 mi/gal; As the weight towed by the vehicle increases, the
miles per gallon decreases. |
|
|
|
2.
|
The scatter plot below shows the amount of weight towed by a vehicle and its
average miles per gallon. 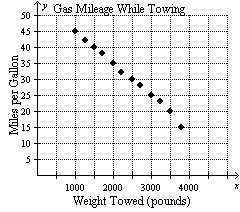 How many pounds does the vehicle that gets 30
miles per gallon tow? How many miles per gallon does the vehicle that tows 3000 pounds
get? What tends to happen as the miles per gallon of a vehicle decreases? a. | 2500 pounds; 25 mi/gal; As the miles per gallon of the vehicle decreases,
the weight increases. | b. | 2500 pounds; 25 mi/gal; As the miles
per gallon of the vehicle decreases, the weight decreases. | c. | 2000 pounds;
30 mi/gal; As the miles per gallon of the vehicle decreases, the weight
increases. | d. | 2000 pounds; 30 mi/gal; As the miles per gallon of the vehicle decreases,
the weight decreases. |
|
|
|
3.
|
Describe the relationship between the data. Identify any outliers, gaps, or
clusters. 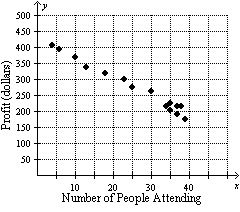 a. | The scatter plot shows a nonlinear relationship with a gap in the data from  | b. | The scatter plot shows a negative linear relationship with a cluster below  | c. | The scatter plot shows a nonlinear relationship with no obvious outliers, gaps, or
clusters in the data. | d. | The scatter plot shows a negative linear
relationship with a gap in the data from  |
|
|
|
4.
|
The table shows the number of cats and the number of mice found in a
barn. Cats, x | 2 | 1 | 4 | 5 | 9 | 7 | 6 | 8 | 2 | 3 | 9 | 5 | 7 | 3 | 6 | Mice, y | 77 | 75 | 72 | 60 | 55 | 62 | 59 | 52 | 73 | 76 | 49 | 69 | 54 | 66 | 66 | | | | | | | | | | | | | | | | |
Make a scatter plot of the data and draw a line of fit. Write an
equation of the line of fit.
|
|
|
5.
|
Find and interpret the marginal frequencies. | | | Movie Rating | | | | PG | PG-13 | Age | Under 18 | 70 | 46 | 18 or Older | 33 | 78 | | | | |
a. | 116 people watched a movie rated PG, 111 people watched a movie rated PG-13,
103 people were under 18, 124 people were 18 or older. | b. | 103 people 18
or older watched a movie rated PG, 124 people under 18 watched a movie rated
PG-13. | c. | 103 people watched a movie rated PG, 124 people watched a movie rated PG-13,
116 people were under 18, 111 people were 18 or older. | d. | 116 people 18
or older watched a movie rated PG, 111 people under 18 watched a movie rated
PG-13. |
|
|
|
6.
|
Choose an appropriate data display for the situation. Explain your
reasoning.
the amount of time spent in different activities throughout the day
a. | circle graph; shows frequencies of data values in intervals of the same
size | b. | stem-and-leaf plot; shows data as parts of a whole | c. | line graph; shows
changes over time | d. | circle graph; shows data as parts of a whole
|
|
Other
|
|
|
7.
|
Extended Response The table shows the amount of bird seed that must
be placed into the bird feeder in order to satisfy the number of birds that come to eat. | Number of Birds,
x | 2 | 4 | 6 | 8 | 10 | 12 | 14 | 16 | | Bird Seed (ounces), y | 1 | 11 | 15 | 17 | 35 | 38 | 35 | 50 | | | | | | | | | |
a. Graph the data in the table and draw a line of
fit. b. Write an equation of the line of fit. c. Predict how much bird
seed would be needed if 22 birds came. d. Does the line
of fit seem to be accurate? Explain your reasoning.
|