Multiple Choice
Identify the
choice that best completes the statement or answers the question.
|
|
|
1.
|
Find the mean and standard deviation of the data.
29, 27, 46, 47, 31, 41, 42,
49
a. | 39; about 8.2 | c. | 39; about 66.75 | b. | 41.5; about 8.2 | d. | 41.5;
about 66.75 |
|
|
|
2.
|
Make a box-and-whisker plot for the data.
Number of hotdogs sold
48, 30,
41, 51, 51, 55, 16, 59
|
|
|
3.
|
Display the data in a histogram. Describe the shape of the distribution. Number of Books Read | Frequency | 0 – 1 | 2 | 2 – 3 | 4 | 4 – 5 | 6 | 6 – 7 | 7 | 8 – 9 | 6 | 10 – 11 | 4 | 12 – 13 | 2 | | |
a. | 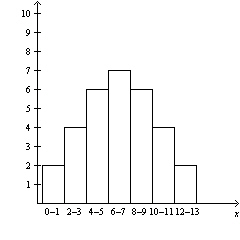 Most of the data are on the left. So, the
distribution is skewed right. Most of the data are on the left. So, the
distribution is skewed right. | c. | 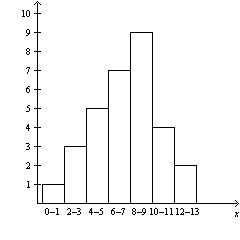 The distribution is high in the middle, and the
data are about evenly distributed on both sides. So, the distribution is
symmetric. The distribution is high in the middle, and the
data are about evenly distributed on both sides. So, the distribution is
symmetric. | b. | 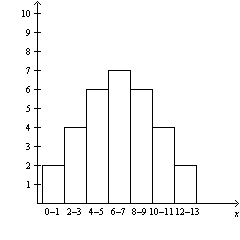 The distribution is high in the middle, and the
data are about evenly distributed on both sides. So, the distribution is
symmetric. The distribution is high in the middle, and the
data are about evenly distributed on both sides. So, the distribution is
symmetric. | d. | 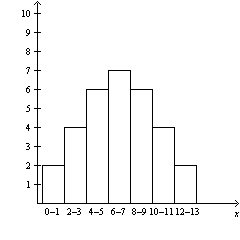 Most
of the data are on the right. So, the distribution is skewed left. Most
of the data are on the right. So, the distribution is skewed left. |
|
|
|
4.
|
Determine which measures of central tendency and dispersion best represent the
data. Explain your reasoning. 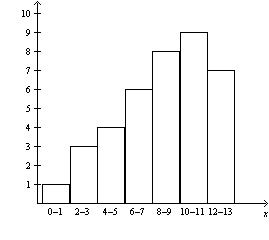 a. | Because the distribution is high on the right and the tail of the graph extends to
the left, the distribution is skewed left. So, the median best represents the center of the data and
the five-number summary best represents the spread of the data. | b. | Because the
distribution is high on the left and the tail of the graph extends to the right, the distribution is
skewed right. So, the median best represents the center of the data and the five-number summary best
represents the spread of the data. | c. | Because the distribution is high on the right
and the tail of the graph extends to the left, the distribution is skewed left. So, the mean best
represents the center of the data and the standard deviation best represents the spread of the
data. | d. | Because the distribution is high on the left and the tail of the graph extends to the
right, the distribution is skewed right. So, the mean best represents the center of the data and the
standard deviation best represents the spread of the data. |
|
|
|
5.
|
The scatter plot below shows the number of passengers and the amount of cargo
(in pounds) carried on a ferry boat on each trip it takes. 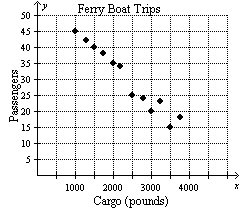 Which of the
following statements is NOT true? a. | As the number of passengers carried by the ferry decreases, the weight of the cargo
increases. | b. | The trip that carried 2800 pounds of cargo had 29 passengers. | c. | The trip that
carried 3000 pounds of cargo had 20 passengers. | d. | The trip that had 45 passengers carried
1000 pounds of cargo. |
|
|
|
6.
|
What equation best models the data in the table below? x | –4 | –3 | –2 | –1 | 0 | 1 | 2 | 3 | 4 | y | –118 | –110 | –112 | –110 | –106 | –99 | –104 | –100 | –99 | | | | | | | | | | |
|
|
|
7.
|
You randomly survey students in your school. You ask whether or not they can
swim. You display your results in the two-way table below. | | | Can Swim | | | | Yes | No | Gender | Male | 16 | 10 | Female | 12 | 45 | | | | |
Which of
the following statements is true? a. | Less female students were surveyed than male students. | b. | Less students cannot
swim than can swim. | c. | The number of female students who cannot swim
is less than the number of male students who can swim. | d. | The total number of students surveyed is 83.
|
|
Other
|
|
|
8.
|
Extended Response The double box-and-whisker plot compares the average
monthly rainfall (in inches) of two towns. a. Identify the shape of each
distribution.
b. What is the range of the upper 75% of each
town?
c. Compare the interquartile ranges of the two data
sets.
d. Which town’s average monthly rainfall is more spread
out?
  Rainfall (inches) Rainfall (inches)
|