Short Answer
|
|
|
Make a stem-and-leaf plot of the data.
|
|
|
1.
|
Hours Online | 12 | 13 | 7 | 23 | 9 | 14 | 11 | 9 | 7 | 23 | 5 | 21 | | | | |
|
|
|
2.
|
Test
Scores (%) | 86 | 63 | 95 | 74 | 63 | 95 | 95 | 99 | 99 | 63 | 78 | 94 | 67 | 75 | 87 | | | | | |
|
|
|
Display the data in a histogram.
|
|
|
3.
|
Pairs of Shoes Owned | Shoes | Frequency | 1-5 | 13 | 6-10 | 12 | 11-15 | 5 | 16-20 | 4 | | |
|
|
|
4.
|
On
Hold | Minutes | Frequency | 0-2 | 2 | 3-5 | 4 | 6-8 | 7 | 9-11 | 5 | 12-14 | 3 | | |
|
|
|
Display the data in a circle graph.
|
|
|
5.
|
Season | Rainfall (inches) | Spring | 18 | Summer | 4 | Fall | 10 | Winter | 8 | | |
|
|
|
6.
|
Trucking | Distance (miles) | Route 1 | 300 | Route
2 | 250 | Route 3 | 800 | Route 4 | 750 | Route 5 | 400 | | |
|
|
|
Which sample is better for making a prediction? Explain.
|
|
|
7.
|
Predict the number of students in a
school who like scrapbooking | Sample A | A random sample of 24 students
from an assembly | Sample B | A random sample of 50 students from an
assembly | | |
|
|
|
8.
|
Predict the number of defective parts
produced per day | Sample A | A random sample of 200 parts from 4
machines | Sample B | A random sample of 200 parts from 24
machines | | |
|
Other
|
|
|
1.
|
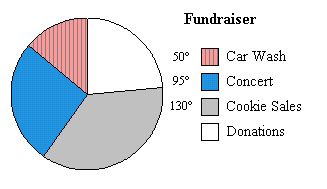
Extended Response A charity had several fundraising activities to
raise a total of $10,800.  a. Find the
amount collected for each fundraiser. b. Chocolate chip cookies were  of the cookie sales. Find the angle measure of the section that would represent chocolate
chip cookie sales on the circle graph.
|